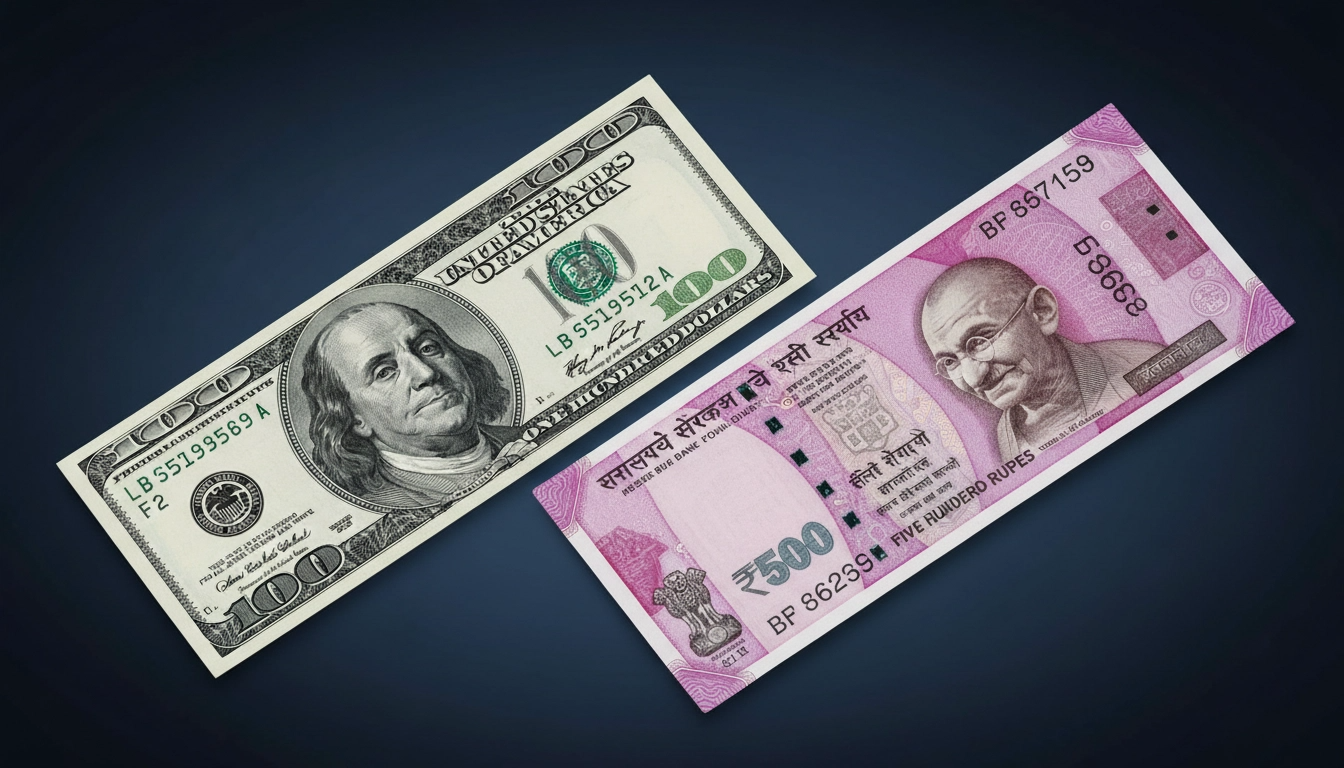
From ₹3.3/USD to ₹94.67/USD in eight decades
The recent framework peace agreement between the United States and Iran has sent ripples through global energy markets, causing Brent crude prices to plummet from a peak of $120 a barrel to around $83.55 [1]. With the critical Strait of Hormuz slated to reopen — amid daily threats and counter-threats — and the possibility of a prolonged supply shock receding, market speculators anticipated a significant strengthening of the Indian Rupee, which had tumbled to a historic low of ₹96.96 against the US dollar in May 2026 [2]. However, the reality has been more muted. The rupee has only managed a modest recovery, hovering around ₹94.67 per dollar [3].
To understand why the Indian currency hasn’t experienced the dramatic rebound many hoped for, one must look beyond immediate geopolitical developments. The rupee’s current valuation is not merely a reaction to today’s oil prices, but the culmination of a 79-year journey marked by structural economic shifts, persistent trade deficits, and evolving global dynamics.
The Mirage of an Immediate Rebound
The anticipation that falling oil prices would immediately rescue the rupee stems from India’s heavy reliance on imported crude. Historically, high oil prices have widened India’s current account deficit and drained foreign exchange reserves, putting downward pressure on the currency. However, the current scenario is complex.
While the US-Iran deal is a positive signal, experts warn that a return to normal shipping through the Strait of Hormuz will take time. Tankers are currently out of position, insurance costs remain high, and lingering damage to energy infrastructure will take months to repair [1]. Consequently, oil prices are expected to average in the mid-$80s by the end of 2026 as the market assesses the reality of the situation [1].
More importantly, the rupee’s recent weakness is driven less by the current account deficit—which is expected to widen to a manageable 2.1% of GDP in 2026—and more by weak capital inflows [4]. Foreign institutional investors (FIIs) have been pulling capital out of Indian equity markets, which have traded at a significant premium compared to other emerging markets [4]. Furthermore, while gross Foreign Direct Investment (FDI) remains stable, net FDI has dropped by nearly 80% over the past four years due to increased repatriation by foreign investors and outward investments by Indian firms [4].
These structural capital flow issues mean that a drop in oil prices alone is insufficient to trigger a massive rupee appreciation. To truly comprehend the currency’s current position, we must trace its trajectory since India’s independence.
From Parity to Depreciation: The Early Decades (1947-1991)
When India gained independence in 1947, the global financial architecture was vastly different. The US dollar was pegged to gold, and the British Pound was the dominant benchmark. At that time, the Indian rupee was worth 1 shilling and 6 pence, translating to an exchange rate of approximately ₹3.30 to the US dollar [5].
During the early post-independence years, India operated under a fixed exchange rate system, aiming to stabilize international trade. However, this rigid structure limited the currency’s ability to adjust to economic realities. In 1949, when the British pound was devalued against the dollar, the rupee followed suit, shifting the exchange rate to ₹4.76 per dollar [5].
The illusion of a strong, stable rupee was shattered in 1966. Following a severe drought and under pressure from the World Bank, the Indian government was forced to devalue the currency to ₹7.50 per US dollar [6]. This period was also marked by economic strain from wars with Pakistan and China, which severely depleted India’s foreign exchange reserves.
The 1970s brought further turbulence. The global oil crisis ignited inflationary pressures worldwide. By 1975, the exchange rate had slipped to ₹8.39, and the Reserve Bank of India (RBI) transitioned the currency from a par value method to a basket peg system [5]. Throughout these decades, India’s persistent trade deficits—importing more than it exported—laid the groundwork for long-term currency depreciation.
Liberalization and the Free Market Reality (1991-2000)
The year 1991 marked a watershed moment in Indian economic history. Facing a severe balance of payments crisis, India initiated sweeping economic reforms, liberalizing its markets and opening up to foreign investment. As part of these reforms, the country abandoned the fixed exchange rate system in favor of a more flexible, market-determined rate [5].
The immediate impact was a sharp depreciation. The exchange rate jumped to ₹17.01 in 1990 and quickly escalated. By the year 2000, the dollar rate had increased dramatically, with 1 USD equivalent to roughly ₹44.31 [5].
This depreciation was not entirely negative; it was partly a deliberate policy choice to make Indian exports more competitive globally and attract foreign capital. However, it also exposed the rupee to the volatility of global financial markets, such as the Asian financial crisis in the late 1990s.
The 21st Century: Growth Amidst Currency Weakness (2001-2026)
The paradox of the Indian economy in the 21st century has been robust GDP growth coupled with a persistently depreciating currency.
| Year | Exchange Rate (1 USD to INR) | Key Economic Context |
| 2001 | ₹47.69 | Post-liberalization stabilization |
| 2008 | ₹43.30 | Pre-Global Financial Crisis strength |
| 2013 | ₹54.78 | “Taper Tantrum” capital flight |
| 2020 | ₹74.31 | COVID-19 pandemic economic shock |
| 2022 | ₹81.62 | Post-pandemic recovery and inflation |
| 2024 | ₹85.56 | Widening trade deficits |
| 2026 (June) | ₹94.67 | Geopolitical tensions and capital outflows |
Table 1: Historical USD to INR Exchange Rates and Key Contexts [5]
The 2008 global financial crisis and the 2013 “Taper Tantrum” demonstrated the rupee’s vulnerability to external shocks and foreign capital flight. More recently, the COVID-19 pandemic introduced unprecedented complexities, pushing the currency past the ₹74 mark in 2020 [5].
By 2026, the depreciation accelerated. The recent Iran-Israel conflict, which spiked oil prices and disrupted global shipping, pushed the rupee to its historic low of ₹96.96 in May [2]. While the RBI has intervened by selling dollars to prevent a freefall and ensure an orderly market, Governor Sanjay Malhotra has acknowledged that the rupee may have become undervalued [3].
The Indian rupee’s 79-year journey from ₹3.30 to ₹94.67 per dollar is a reflection of a developing economy integrating into the global financial system. It highlights a fundamental economic reality: a currency’s strength is determined by a complex interplay of inflation differentials, trade balances, and capital flows, not just the daily fluctuations of crude oil.
While the US-Iran peace deal provides welcome relief to energy markets, it does not erase India’s structural economic challenges. Until India can sustainably narrow its trade deficit, align its inflation rates with developed economies, and attract robust, long-term capital inflows, the rupee is likely to remain under pressure. For now, the expectation of a sudden, dramatic strengthening of the Indian currency remains, much like the immediate reopening of the Strait of Hormuz, an optimistic mirage.
References
[1] BBC News. “How could the US-Iran deal affect oil prices and the cost of food?” https://www.bbc.com/news/articles/cd0p8me2m5do [2] Reuters. “Oil slump, central bank support manifest in rupee’s three-day winning streak.” https://www.reuters.com/world/india/rupee-extend-rally-us-iran-deal-hopes-rbi-governors-remarks-aid-sentiment-2026-05-25/ [3] Trading Economics. “Indian Rupee – Quote – Chart – Historical Data – News.” https://tradingeconomics.com/india/currency [4] ING Think. “What lies ahead for the Indian rupee in a higher oil price environment.” https://think.ing.com/articles/what-lies-ahead-for-the-indian-rupee-in-a-higher-oil-price-environment/ [5] Forbes India. “Dollar to rupee value since 1947: USD to INR rate chart and key milestones.” https://www.forbesindia.com/article/explainers/1-usd-to-inr-history/88635/1 [6] Wikipedia. “Exchange rate history of the Indian rupee.” https://en.wikipedia.org/wiki/Exchange_rate_history_of_the_Indian_rupee